Object ccTrack will call the function circlize::circos.trackPlotRegion while drawing.
Usage
ccTrack(
  sectors = NULL,
  x = NULL,
  y = NULL,
  ylim = NULL,
  force.ylim = TRUE,
  track.index = NULL,
  track.height = circos.par("track.height"),
  track.margin = circos.par("track.margin"),
  cell.padding = circos.par("cell.padding"),
  bg.col = NA,
  bg.border = "black",
  bg.lty = par("lty"),
  bg.lwd = par("lwd"),
  panel.fun = function(x, y) {
     NULL
 },
  factors = sectors
)
Arguments
- sectors
A
factoror a character vector which represents categories of data, if it isNULL, then it uses all sector index.- x
Data on x-axis. It is only used if
panel.funis set.- y
Data on y-axis
- ylim
Range of data on y-axis
- force.ylim
Whether to force all cells in the track to share the same
ylim. Normally, all cells on a same track should have sameylim.- track.index
Index for the track which is going to be created/updated. If the specified track has already been created, this function just updated corresponding track with new plot. If the specified track is
NULLor has not been created, this function just creates it. Note the value for this argument should not exceed maximum track index plus 1.- track.height
Height of the track. It is the percentage to the radius of the unit circles. The value can be set by
uhto an absolute unit. If updating a track (with propertrack.indexvalue), this argument is ignored.- track.margin
only affect current track
- cell.padding
only affect current track
- bg.col
Background color for the plotting regions. It can be vector which has the same length of sectors.
- bg.border
Color for the border of the plotting regions. It can be vector which has the same length of sectors.
- bg.lty
Line style for the border of the plotting regions. It can be vector which has the same length of sectors.
- bg.lwd
Line width for the border of the plotting regions. It can be vector which has the same length of sectors.
- panel.fun
Panel function to add graphics in each cell, see "details" section and vignette for explanation.
- factors
The same as
sectors. It will be removed in future versions.
Value
Object ccTrack
Examples
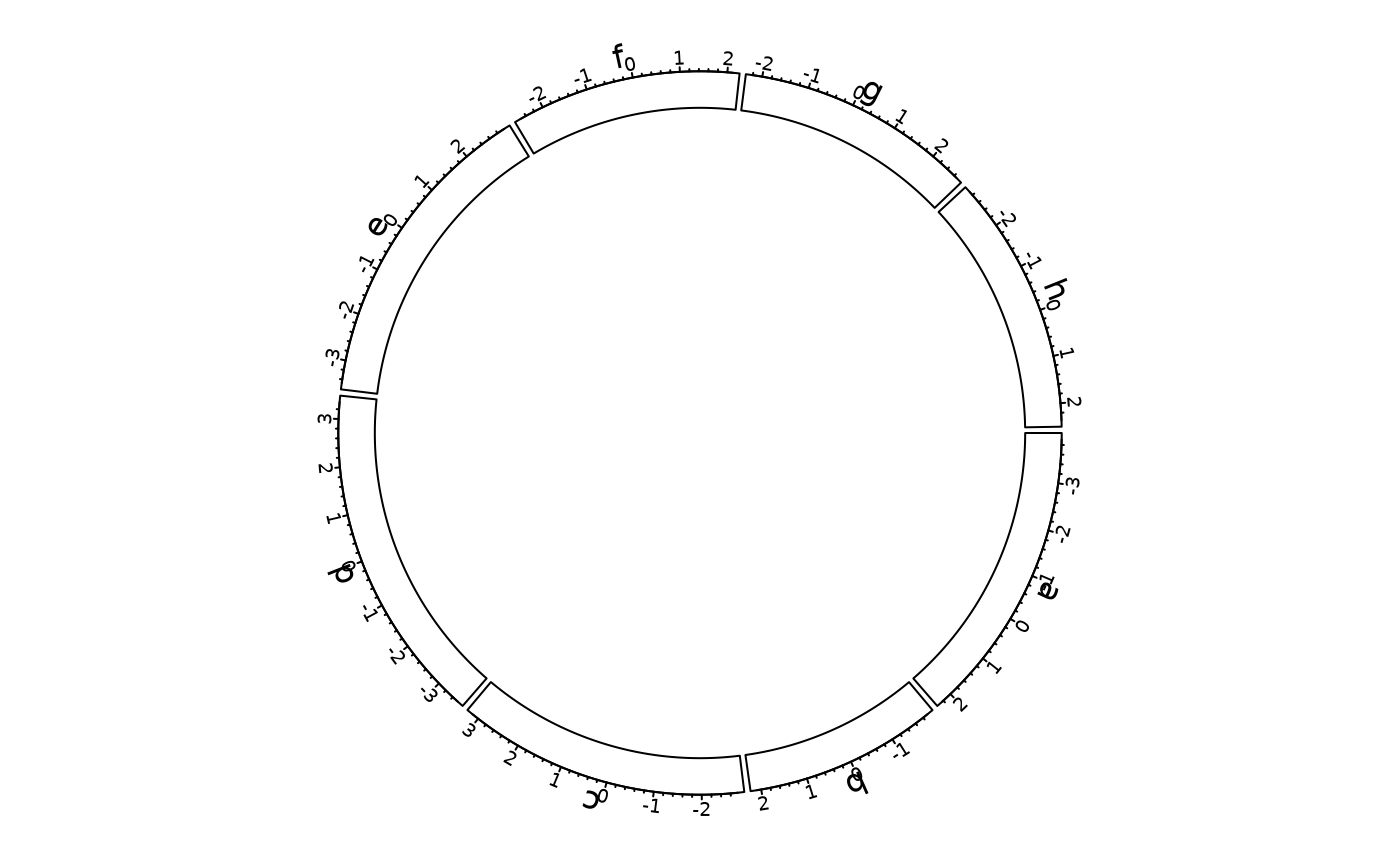
library(circlizePlus)
n = 1000
df = data.frame(sectors = sample(letters[1:8], n, replace = TRUE),
                x = rnorm(n), y = runif(n))
library(circlizePlus)
par1=ccPar("track.height" = 0.1)
cc=ccPlot(sectors = df$sectors, x = df$x) + par1
track1 = ccTrack(sectors = df$sectors, y = df$y,
                 panel.fun = function(x, y) {
                   circos.text(CELL_META$xcenter,
                               CELL_META$cell.ylim[2] + mm_y(5),
                               CELL_META$sector.index)
                   circos.axis(labels.cex = 0.6)
                 })
cc=cc+track1
cc
#> Note: 1 point is out of plotting region in sector 'a', track '1'.
#> Note: 1 point is out of plotting region in sector 'b', track '1'.
#> Note: 1 point is out of plotting region in sector 'c', track '1'.
#> Note: 1 point is out of plotting region in sector 'd', track '1'.
#> Note: 1 point is out of plotting region in sector 'e', track '1'.
#> Note: 1 point is out of plotting region in sector 'f', track '1'.
#> Note: 1 point is out of plotting region in sector 'g', track '1'.
#> Note: 1 point is out of plotting region in sector 'h', track '1'.

circos.clear()