Object ccTrack will call the function circlize::circos.trackHist while drawing.
Usage
ccTrackHist(
  sectors,
  x,
  track.height = circos.par("track.height"),
  track.index = NULL,
  ylim = NULL,
  force.ylim = TRUE,
  col = ifelse(draw.density, "black", NA),
  border = "black",
  lty = par("lty"),
  lwd = par("lwd"),
  bg.col = NA,
  bg.border = "black",
  bg.lty = par("lty"),
  bg.lwd = par("lwd"),
  breaks = "Sturges",
  include.lowest = TRUE,
  right = TRUE,
  draw.density = FALSE,
  bin.size = NULL,
  area = FALSE,
  factors = sectors
)
Arguments
- sectors
A
factoror a character vector which represents the categories of data- x
Data on the x-axis
- track.height
Height of the track. It is the percentage to the radius of the unit circle. If to update a track, this argument is disabled.
- track.index
Index for the track which is going to be updated. Setting it to
NULLmeans creating the plotting regions in the next newest track.- ylim
Ranges on y-direction. By default,
ylimis calculated automatically.- force.ylim
Whether to force all cells in the track to share the same
ylim.- col
Filled color for histogram
- border
Border color for histogram
- lty
Line style for histogram
- lwd
Line width for histogram
- bg.col
Background color for the plotting regions
- bg.border
Color for the border of the plotting regions
- bg.lty
Line style for the border of the plotting regions
- bg.lwd
Line width for the border of the plotting regions
- breaks
see
hist- include.lowest
see
hist- right
see
hist- draw.density
whether draw density lines instead of histogram bars.
- bin.size
size of the bins of the histogram
- area
whether to fill the area below the density lines. If it is set to
TRUE,colcontrols the filled color in the area andbordercontrols color of the line.- factors
The same as
sectors. It will be removed in future versions.
Value
Object ccTrack
Examples
library(circlizePlus)
n = 1000
df = data.frame(sectors = sample(letters[1:8], n, replace = TRUE),
x = rnorm(n), y = runif(n))
library(circlizePlus)
par1=ccPar("track.height" = 0.1)
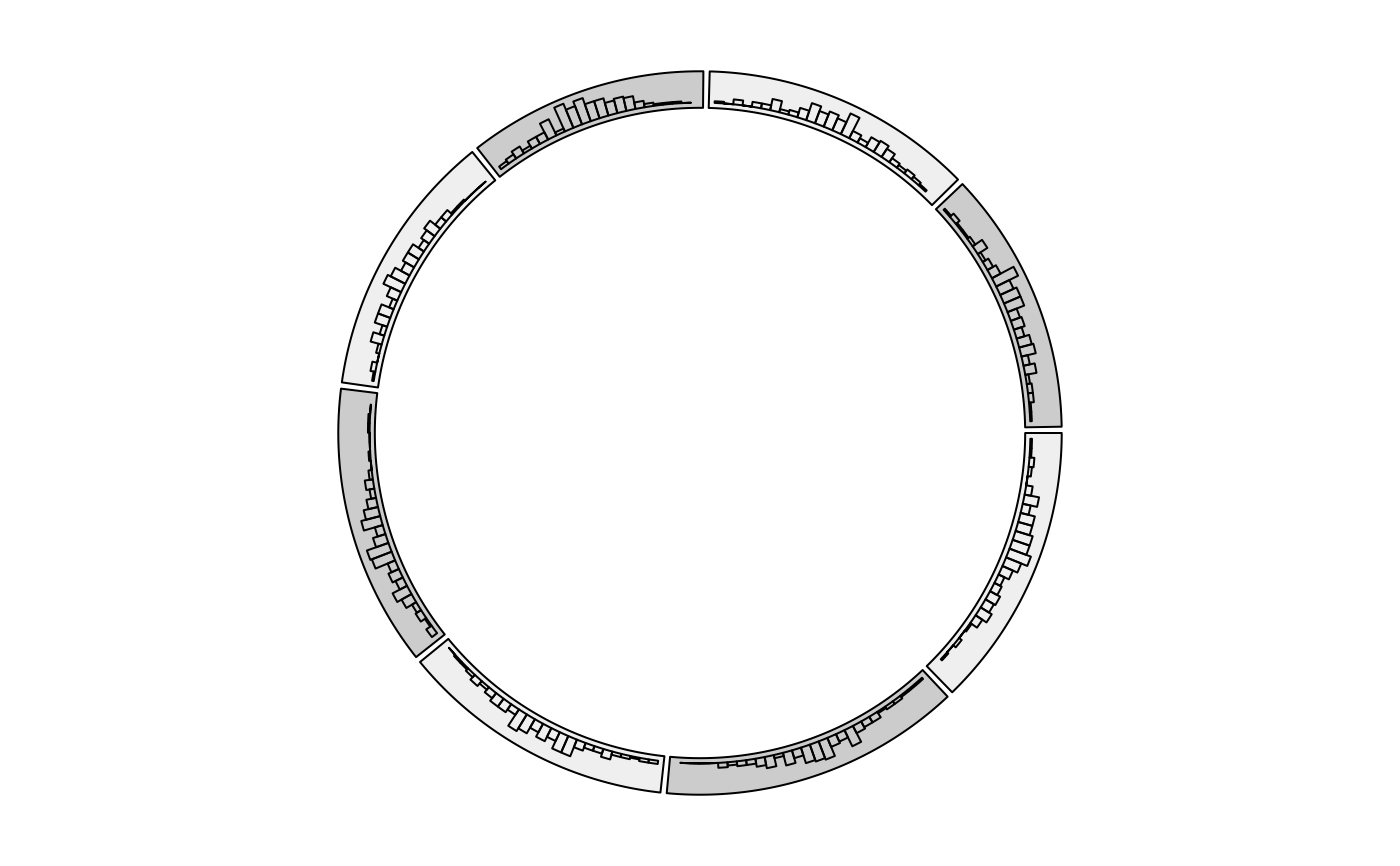
cc=ccPlot(sectors = df$sectors, x = df$x) + par1;bgcol = rep(c("#EFEFEF", "#CCCCCC"), 4)
track2 = ccTrackHist(df$sectors, df$x, bin.size = 0.2, bg.col = bgcol, col = NA)
cc=cc+track2
cc
 circos.clear()