Draw the figures described by ccHeatmap
Arguments
- object
Object of ccHeatmap
Examples
# \donttest{
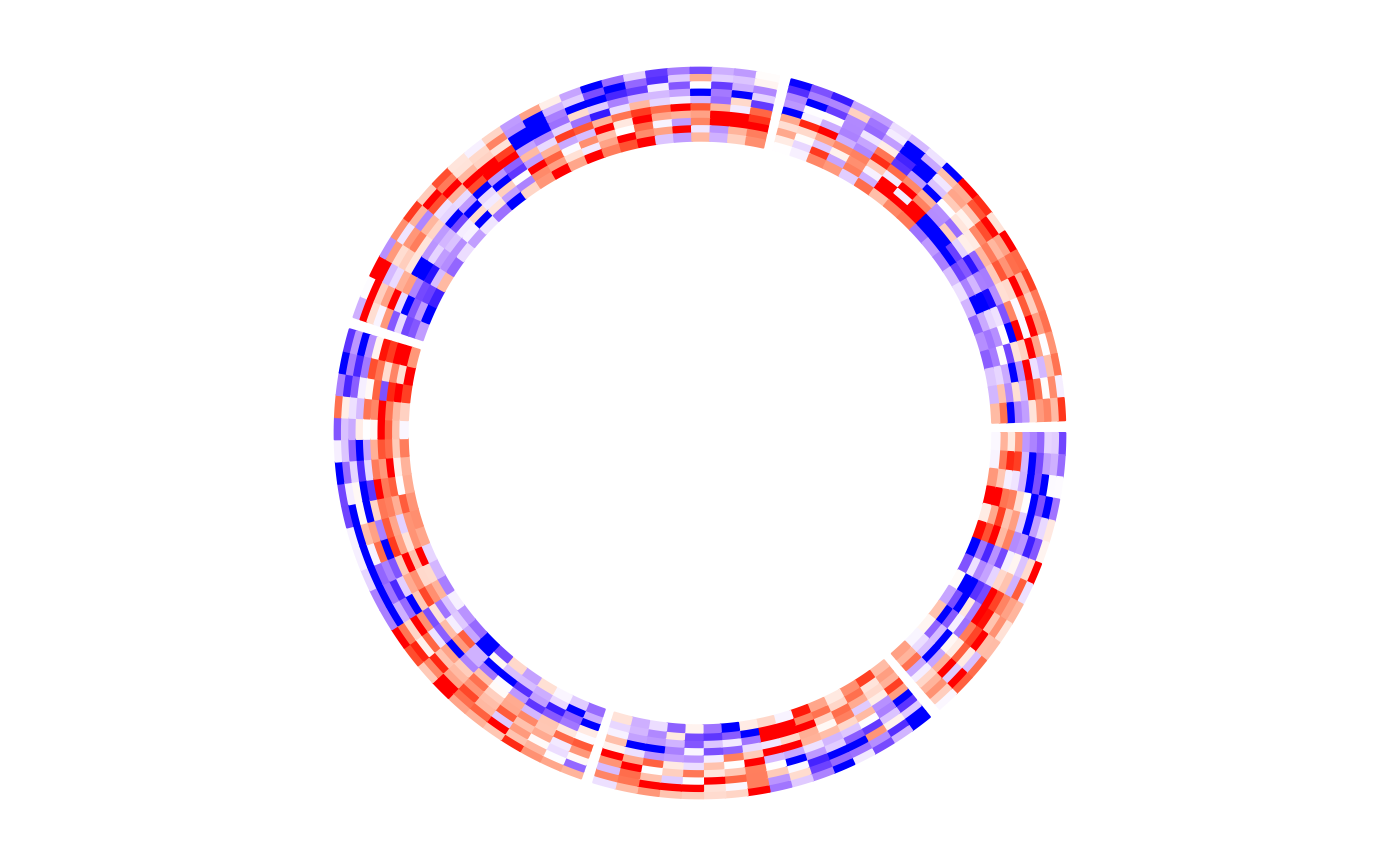
library(circlizePlus)
set.seed(123)
mat1 <- rbind(
cbind(
matrix(rnorm(50 * 5, mean = 1), nr = 50),
matrix(rnorm(50 * 5, mean = -1), nr = 50)
),
cbind(
matrix(rnorm(50 * 5, mean = -1), nr = 50),
matrix(rnorm(50 * 5, mean = 1), nr = 50)
)
)
rownames(mat1) <- paste0("R", 1:100)
colnames(mat1) <- paste0("C", 1:10)
mat1 <- mat1[sample(100, 100), ] # randomly permute rows
split <- sample(letters[1:5], 100, replace = TRUE)
split <- factor(split, levels = letters[1:5])
col_fun1 <- colorRamp2(c(-2, 0, 2), c("blue", "white", "red"))
show(ccHeatmap(mat = mat1, split = split, col = col_fun1))
 # }
# }