Usage
ccBarplot(
  value,
  pos,
  bar_width = 0.6,
  col = NA,
  border = "black",
  lwd = par("lwd"),
  lty = par("lty")
)
Arguments
- value
A numeric vector or a matrix. If it is a matrix, columns correspond to the height of bars.
- pos
Positions of the bars.
- bar_width
Width of bars. It assumes the bars locating at x = 1, 2, ....
- col
Filled color of bars.
- border
Color for the border.
- lwd
Line width.
- lty
Line style.
Examples
library(circlizePlus)
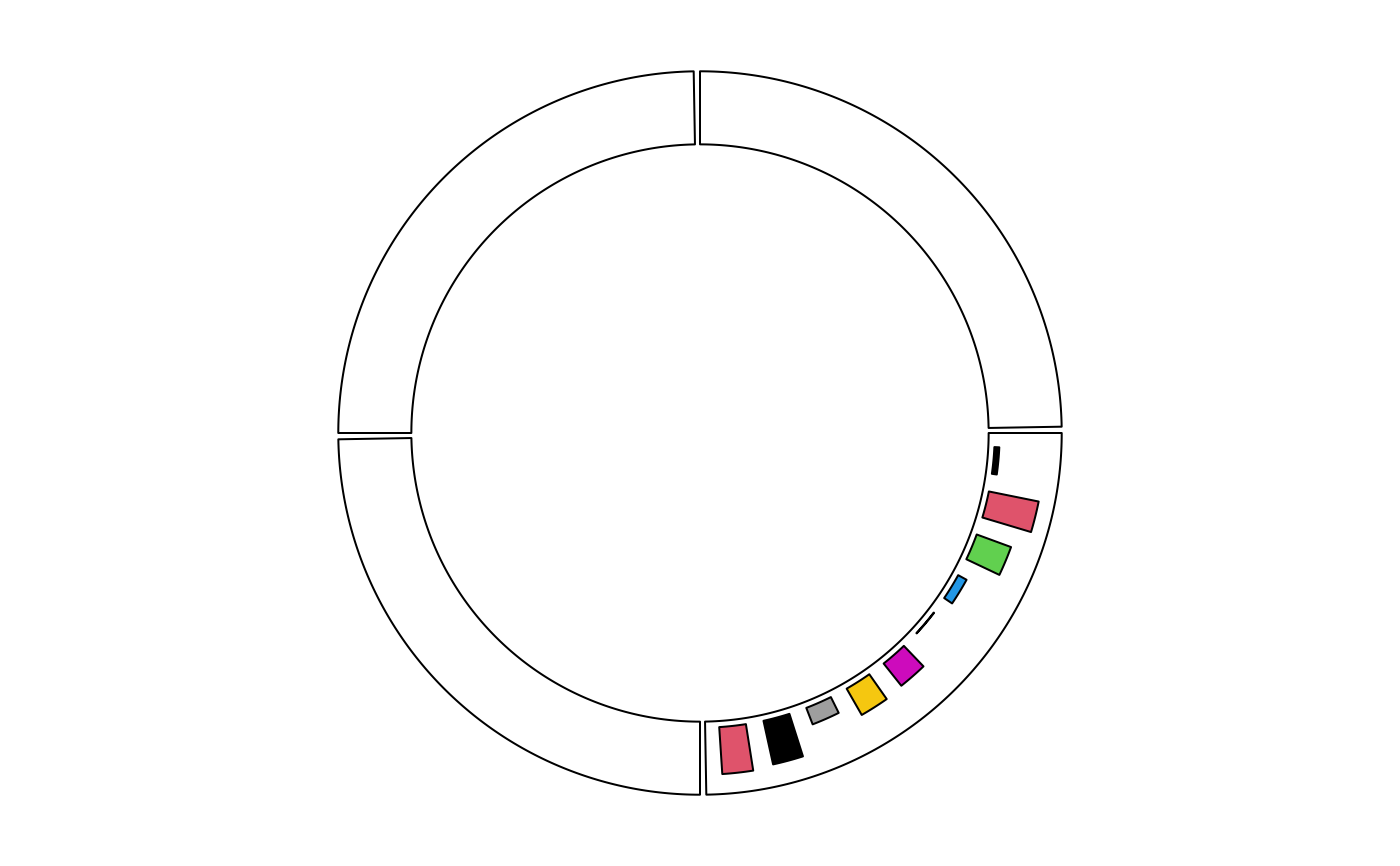
cc <- ccPlot(sectors = letters[1:4], xlim = c(0, 10))
track <- ccTrack(ylim = c(0, 1))
cell <- ccCell(sector.index = "a") + ccBarplot(value = runif(10), pos = 1:10 - 0.5, col = 1:10)
track <- track + cell
cc + track
