Object ccGenomicTrack will call the function circlize::circos.genomicIdeogram while drawing.
Usage
ccGenomicIdeogram(
  cytoband = system.file(package = "circlize", "extdata", "cytoBand.txt"),
  species = NULL,
  track.height = mm_h(2),
  track.margin = circos.par("track.margin")
)
Arguments
- cytoband
A data frame or a file path, pass to
read.cytoband.- species
Abbreviations of the genome, pass to
read.cytoband.- track.height
Height of the ideogram track.
- track.margin
Margins for the track.
Value
Object ccGenomicTrack
Examples
# \donttest{
library(circlizePlus)
cc = ccPlot(initMode = "initializeWithIdeogram",chromosome.index = "chr1", plotType = NULL)
human_cytoband = read.cytoband(species = "hg19")$df
t2=ccGenomicIdeogram(human_cytoband)
#> Warning: `convert_length()` only works when aspect of the coordinate is 1.
cc+t2
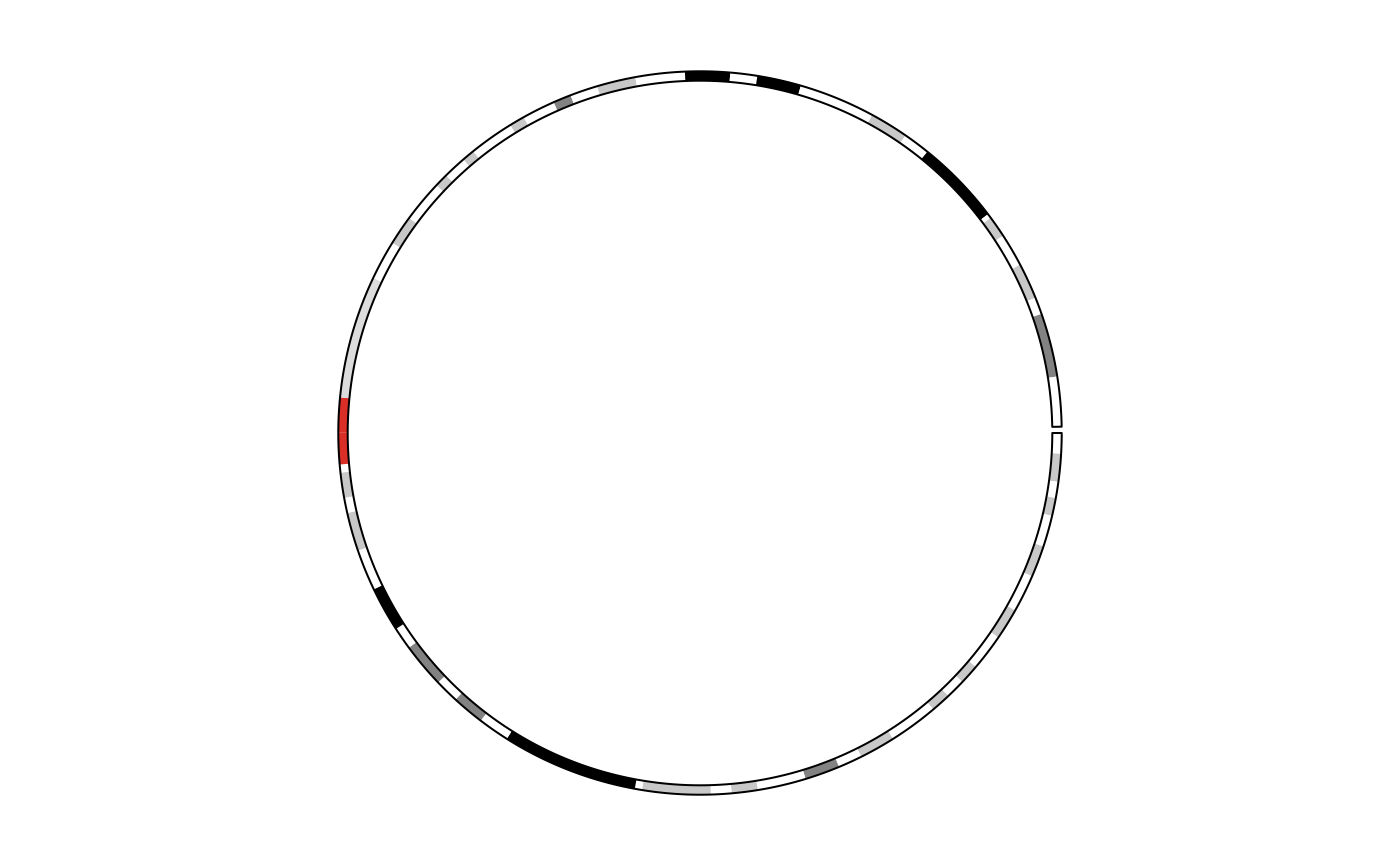 circos.clear()
# }
circos.clear()
# }