Object ccGenomicTrack will call the function circlize::circos.genomicLabels while drawing.
Usage
ccGenomicLabels(
  bed,
  labels = NULL,
  labels.column = NULL,
  facing = "clockwise",
  niceFacing = TRUE,
  col = par("col"),
  cex = 0.8,
  font = par("font"),
  padding = 0.4,
  connection_height = mm_h(5),
  line_col = par("col"),
  line_lwd = par("lwd"),
  line_lty = par("lty"),
  labels_height = NULL,
  side = c("inside", "outside"),
  labels.side = side,
  track.margin = circos.par("track.margin")
)
Arguments
- bed
A data frame in bed format.
- labels
A vector of labels corresponding to rows in
bed.- labels.column
If the label column is already in
bed, the index for this column inbed.- facing
fFacing of the labels. The value can only be
"clockwise"or"reverse.clockwise".- niceFacing
Whether automatically adjust the facing of the labels.
- col
Color for the labels.
- cex
Size of the labels.
- font
Font of the labels.
- padding
Padding of the labels, the value is the ratio to the height of the label.
- connection_height
Height of the connection track.
- line_col
Color for the connection lines.
- line_lwd
Line width for the connection lines.
- line_lty
Line type for the connectioin lines.
- labels_height
Height of the labels track.
- side
Side of the labels track, is it in the inside of the track where the regions are marked?
- labels.side
Same as
side. It will replacesidein the future versions.- track.margin
Bottom and top margins.
Value
Object ccGenomicTrack
Examples
library(circlizePlus)
bed = generateRandomBed(nr = 50, fun = function(k) sample(letters, k, replace = TRUE))
bed[1, 4] = "aaaaa"
cc = ccPlot(initMode = "initializeWithIdeogram", plotType = NULL)
t1 = ccGenomicLabels(bed, labels.column = 4, side = "outside",
col = as.numeric(factor(bed[[1]])), line_col = as.numeric(factor(bed[[1]])))
#> Warning: `convert_length()` only works when aspect of the coordinate is 1.
cc + t1
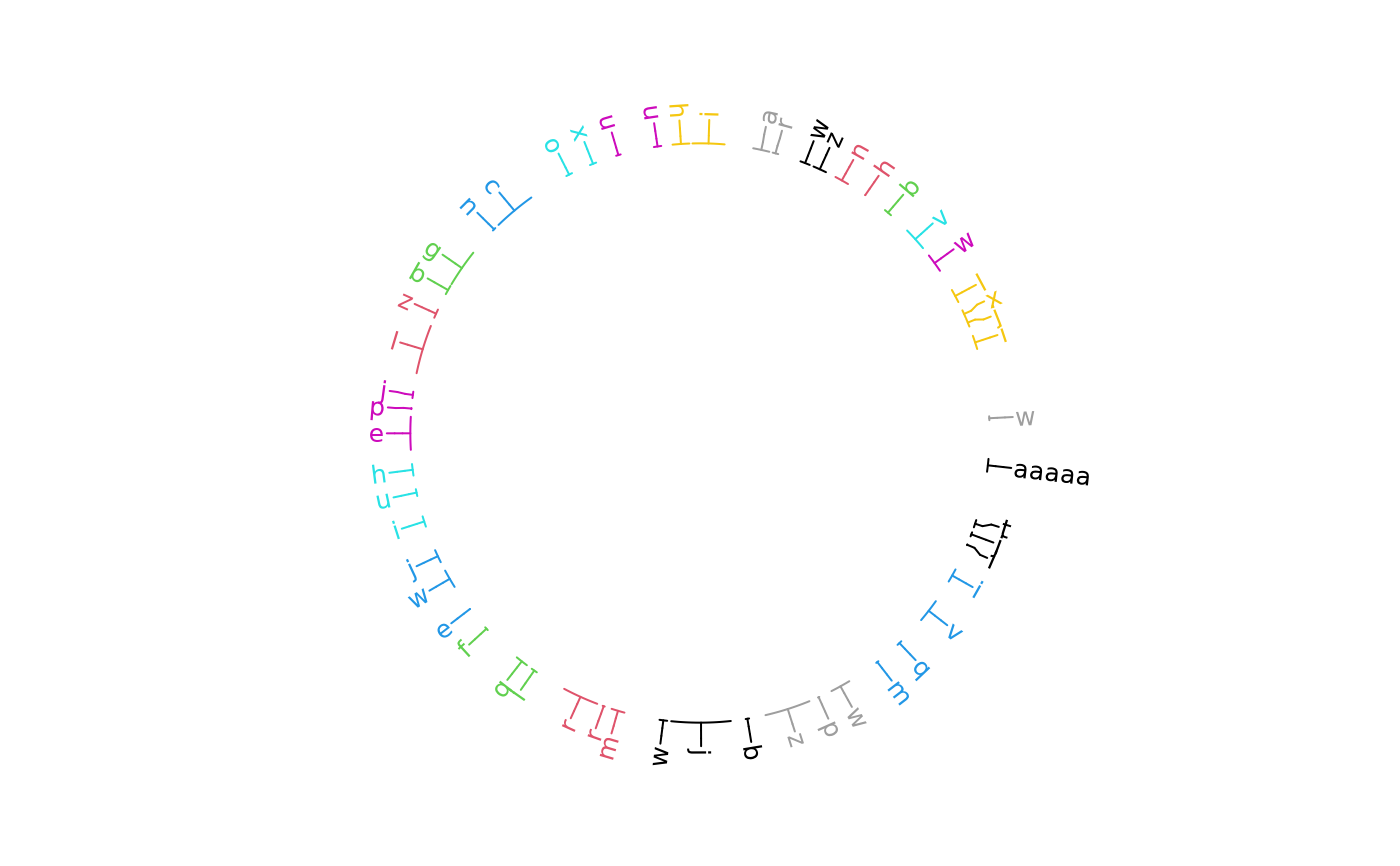 circos.clear()