Object ccGenomicTrack will call the function circlize::circos.genomicRainfall while drawing.
Arguments
- data
A bed-file-like data frame or a list of data frames.
- mode
How to calculate the distance of two neighbouring regions, pass to
rainfallTransform.- ylim
ylim for rainfall plot track. If
normalize_to_widthisFALSE, the value should correspond tolog10(dist+1), and ifnormalize_to_widthisTRUE, the value should correspond tolog2(rel_dist).- col
Color of points. It should be length of one. If
datais a list, the length ofcolcan also be the length of the list.- pch
Style of points.
- cex
Size of points.
- normalize_to_width
If it is
TRUE, the value is the relative distance divided by the width of the region.- ...
Pass to
circos.trackPlotRegion.
Value
Object ccGenomicTrack
Examples
# \donttest{
library(circlizePlus)
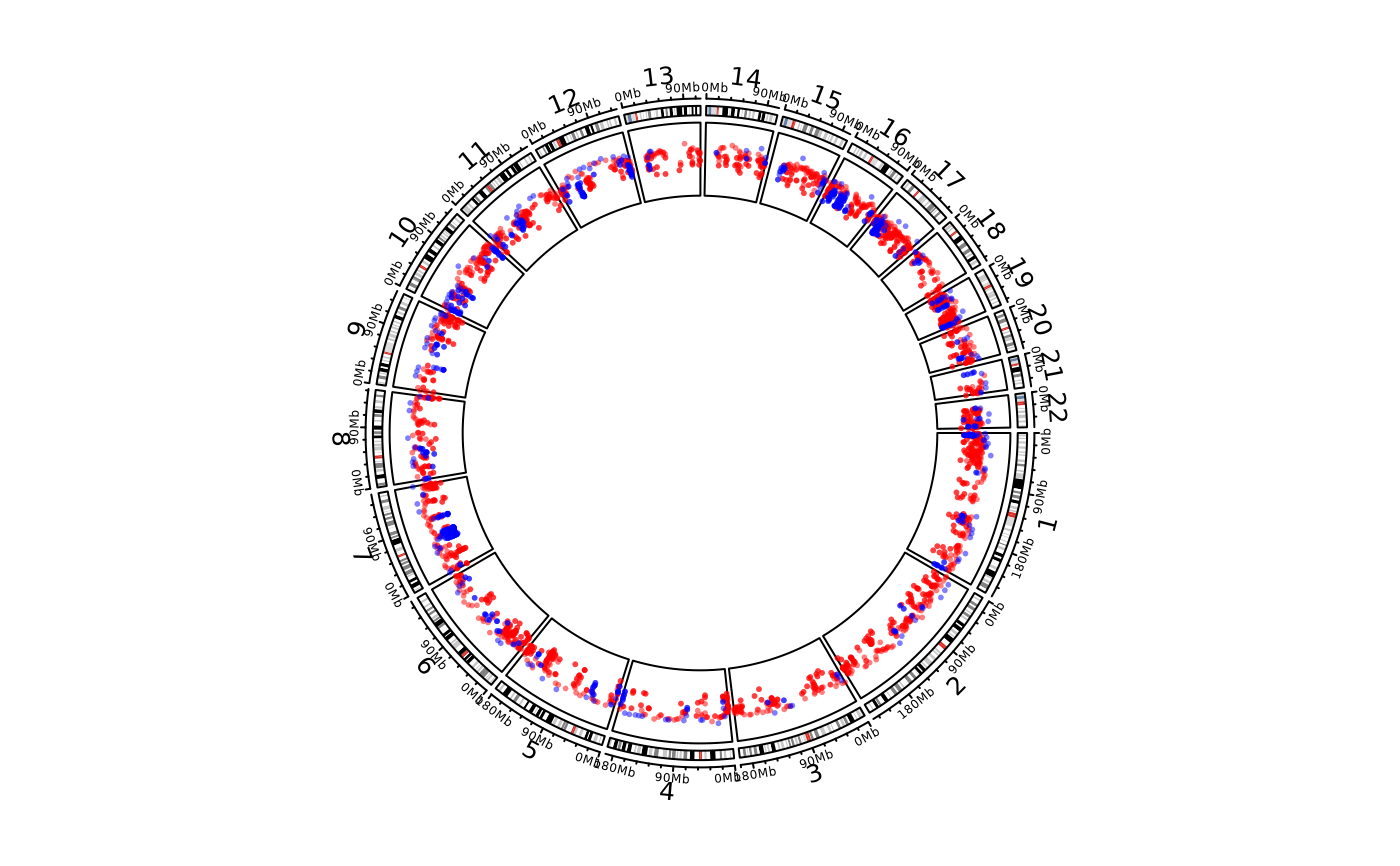
load(system.file(package = "circlize", "extdata", "DMR.RData"))
cc = ccPlot(initMode="initializeWithIdeogram", chromosome.index = paste0("chr", 1:22))
bed_list = list(DMR_hyper, DMR_hypo)
t1 = ccGenomicRainfall(bed_list, pch = 16, cex = 0.4, col = c("#FF000080", "#0000FF80"))
cc + t1
 circos.clear()
# }
circos.clear()
# }