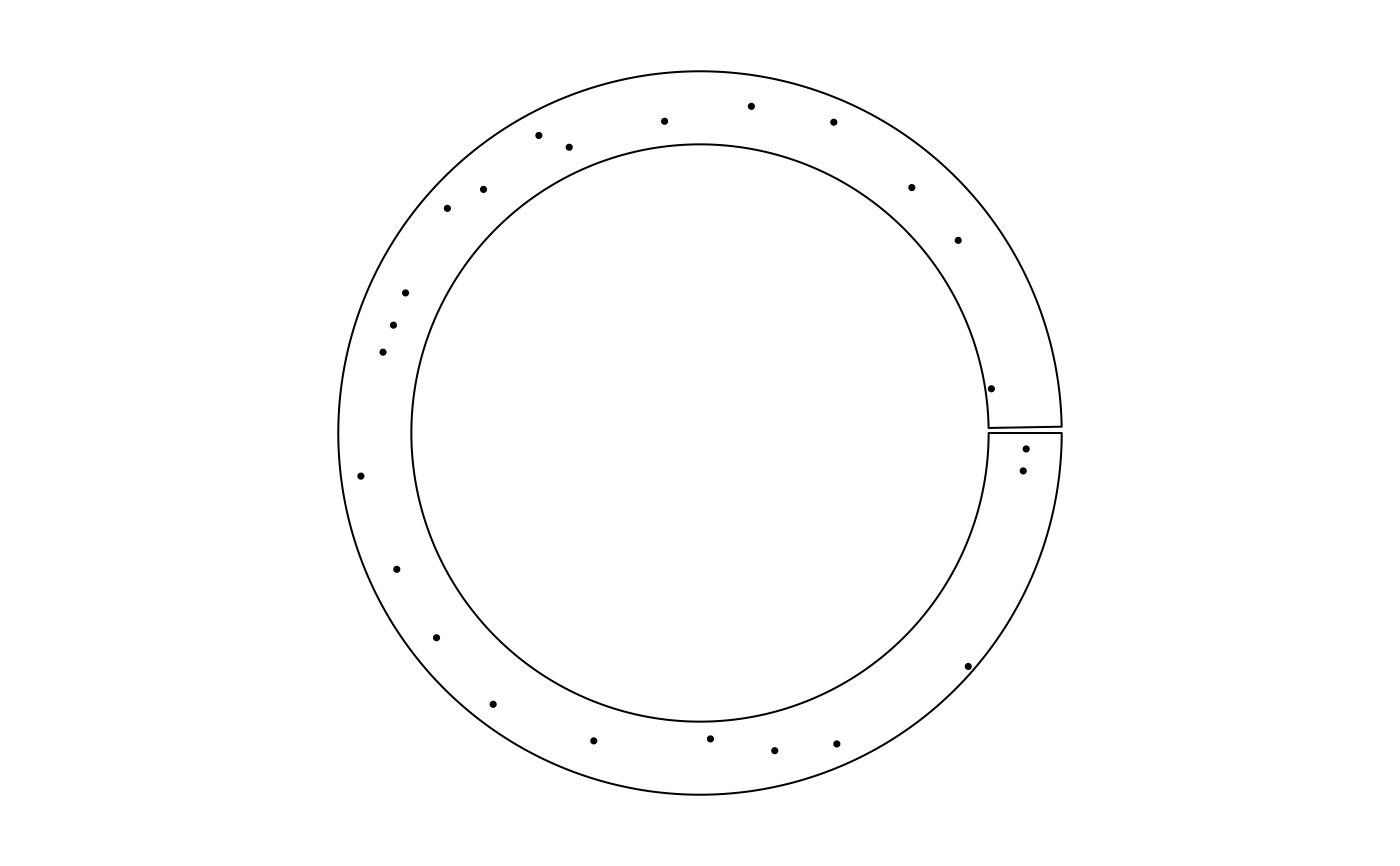
Object ccGenomicTrack will call the function circlize::circos.genomicTrackPlotRegion while drawing.
Usage
ccGenomicTrack(
  data = NULL,
  ylim = NULL,
  stack = FALSE,
  numeric.column = NULL,
  jitter = 0,
  panel.fun = function(region, value, ...) {
     NULL
 },
  ...
)
Arguments
- data
A bed-file-like data frame or a list of data frames
- ylim
If it is
NULL, the value will be calculated from data. Ifstackis set toTRUE, this value is ignored.- stack
whether to plot in a "stack" mode.
- numeric.column
Columns of numeric values in
datathat will be used for plotting. Ifdatais a data frame list,numeric.columnshould be either length of one or length ofdata. If value ofnumeric.columnis not set, its value will depend on the structure ofdata. Ifdatais a data frame, the default value fornumeric.columnis all the numeric column starting from the fourth column. Ifdatais a list of data frame, the default value fornumeric.columnis a vector which have the same length asdataand the value in defaultnumeric.columnis the index of the first numeric column in corresponding data frame.- jitter
Numeric. Only works for adding points in
circos.genomicTrackPlotRegionunderstackmode- panel.fun
Self-defined function which will be applied on each sector. Please not it is different from that in
circos.trackPlotRegion. In this function, there are two arguments (regionandvalue) plus.... In them,regionis a two-column data frame with start positions and end positions in current genomic category (e.g. chromosome).valueis a data frame which is derived fromdatabut excluding the first three columns. Rows invaluecorrespond to rows inregion....is mandatory and is used to pass internal parameters to other functions. The definition ofvaluewill be different according to different input data (data frame or list of data frame) and different settings (stacked or not), please refer to 'details' section and vignettes to detailed explanation.- ...
Pass to
circos.trackPlotRegion.
Value
Object ccGenomicTrack
Examples
library(circlizePlus)
cc = ccPlot(initMode = "initializeWithIdeogram",chromosome.index = "chr1", plotType = NULL)
bed = generateRandomBed(nr = 300)
t1 = ccGenomicTrack(bed, panel.fun = function(region, value, ...) {
  circos.genomicPoints(region, value, pch = 16, cex = 0.5, ...)
})
cc+t1

circos.clear()