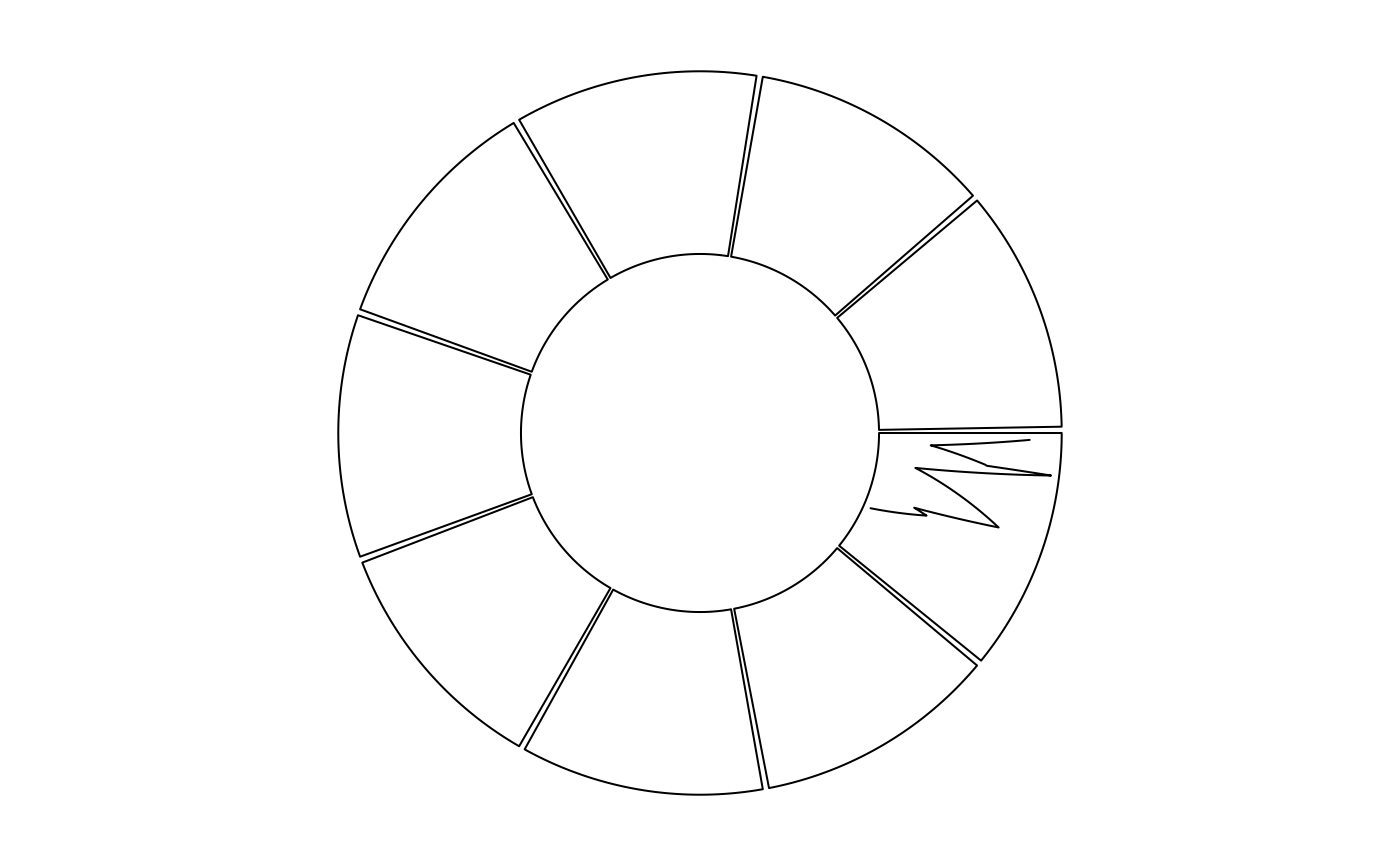
Object ccCellGeom will call the function circlize::circos.lines while drawing.
Arguments
- x
Data points on x-axis, measured in "current" data coordinate.
- y
Data points on y-axis, measured in "current" data coordinate.
- col
Line color.
- lwd
Line width.
- lty
Line style.
- type
Line type, similar as
typeargument inlines, but only inc("l", "o", "h", "s")- straight
Whether draw straight lines between points.
- area
Whether to fill the area below the lines. If it is set to
TRUE,colcontrols the filled color in the area andbordercontrols color of the line.- area.baseline
deprecated, use
baselineinstead.- border
color for border of the area.
- baseline
The base line to draw areas. By default it is the minimal of y-range (bottom). It can be a string or a number. If a string, it should be one of
bottomandtop. This argument also works iftypeis set toh.- pt.col
If
typeis "o", point color.- cex
If
typeis "o", point size.- pch
If
typeis "o", point type.
Value
Object ccCellGeom
Examples
library(circlizePlus)
sectors <- letters[1:9]
par <- ccPar(points.overflow.warning = FALSE)
cc <- ccPlot(sectors = sectors, xlim = c(0, 10))
cc <- cc + par
track <- ccTrack(sectors = sectors, ylim = c(0, 10), track.height = 0.5)
cells <- ccCell(sector.index = "a") + ccLines(sort(x = runif(10) * 10), y = runif(10) * 10)
track <- track + cells
cc + track
