Object ccCellGeom will call the function circlize::circos.points while drawing.
Value
Object ccCellGeom
Examples
library(circlizePlus)
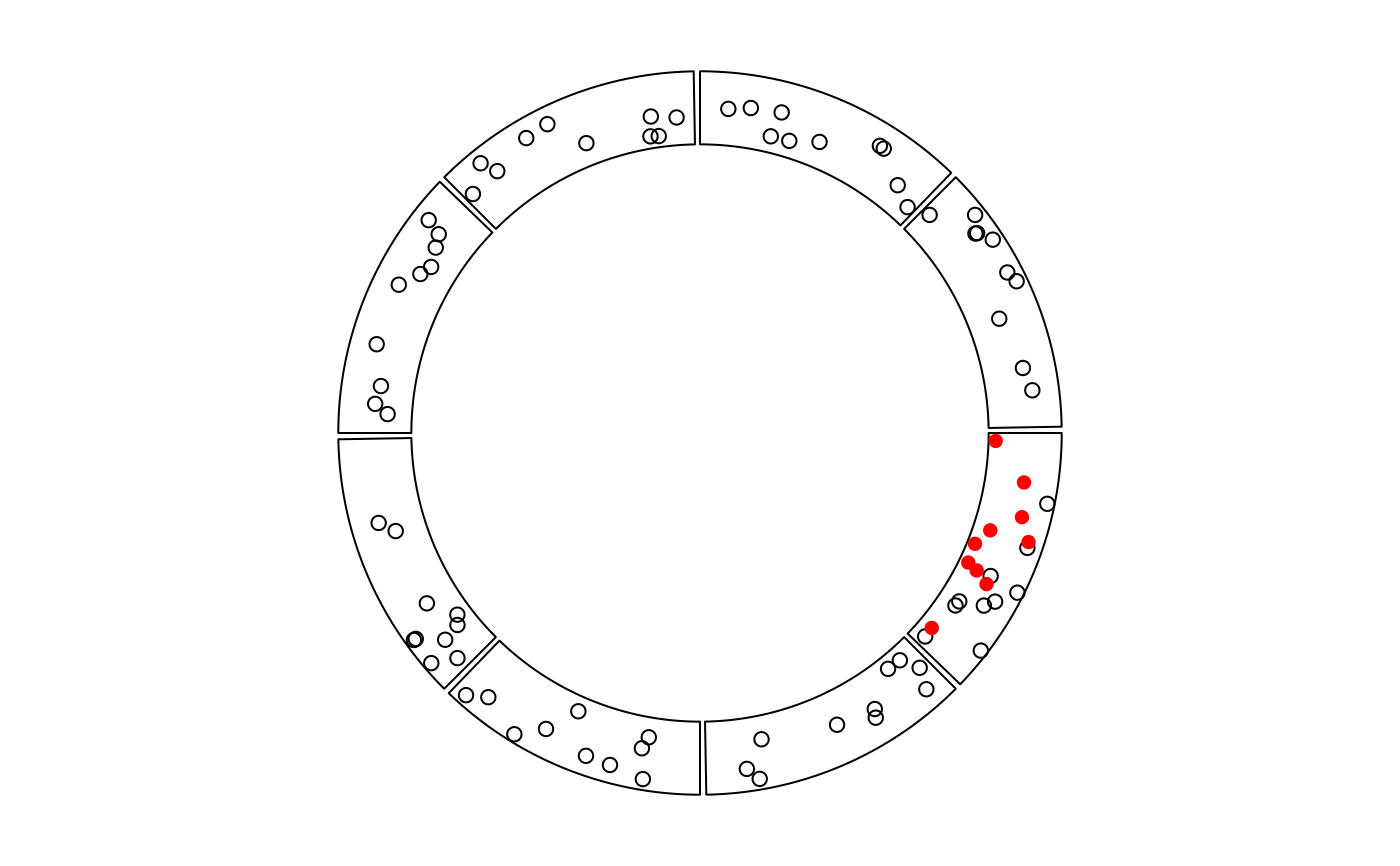
cc <- ccPlot(sectors = letters[1:8], xlim = c(0, 1))
track1 <- ccTrack(ylim = c(0, 1), panel.fun = function(x, y) {
circos.points(runif(10), runif(10))
})
cells <- ccCell(sector.index = "a") + ccPoints(
x = runif(10), y = runif(10),
pch = 16, col = "red"
)
track1 <- track1 + cells
cc + track1