Object ccCellGeom will call the function circlize::circos.violin while drawing.
Arguments
- value
A numeric vector, a matrix or a list. If it is a matrix, boxplots are made by columns.
- pos
Positions of the boxes.
- violin_width
Width of violins.
- col
Filled color of boxes.
- border
Color for the border as well as the quantile lines.
- lwd
Line width.
- lty
Line style
- show_quantile
Whether to show the quantile lines.
- pt.col
Point color
- cex
Point size.
- pch
Point type.
- max_density
The maximal density value across several violins. It is used to compare between violins.
Value
Object ccCellGeom
Examples
# \donttest{
library(circlizePlus)
cc <- ccPlot(sectors = letters[1:4], xlim = c(0, 10))
track <- ccTrack(ylim = c(0, 1))
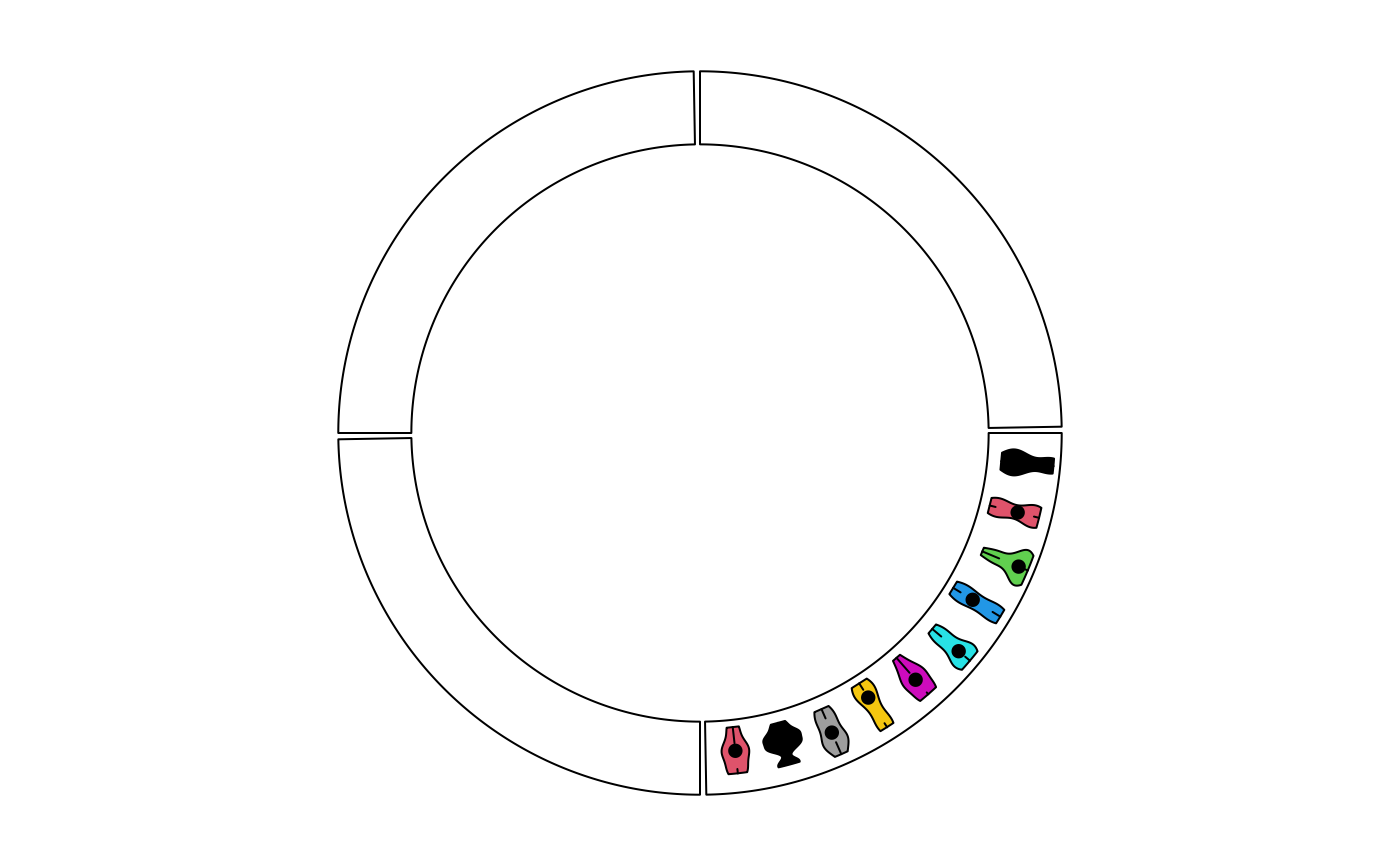
cell <- ccCell(sector.index = "a") + ccViolin(value = replicate(runif(10),
n = 10, simplify = FALSE), pos = 1:10 - 0.5, col = 1:10)
track <- track + cell
cc + track
#> Warning: longer object length is not a multiple of shorter object length
#> Warning: longer object length is not a multiple of shorter object length
#> Warning: longer object length is not a multiple of shorter object length
#> Warning: longer object length is not a multiple of shorter object length
#> Warning: longer object length is not a multiple of shorter object length
#> Warning: longer object length is not a multiple of shorter object length
#> Warning: longer object length is not a multiple of shorter object length
#> Warning: longer object length is not a multiple of shorter object length
 # }
# }