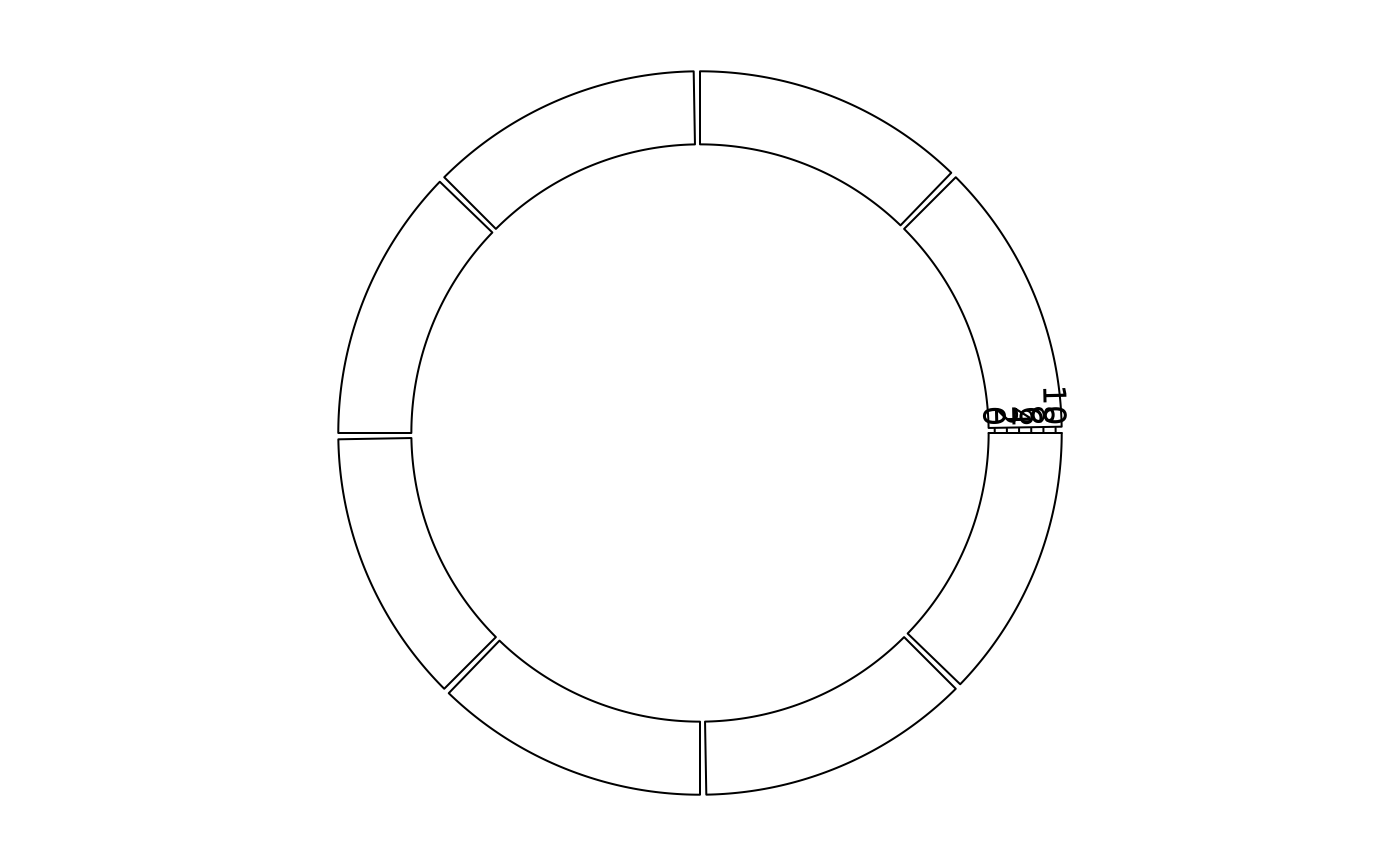
Object ccCellGeom will call the function circlize::circos.yaxis while drawing.
Arguments
- side
add the y-axis on the left or right of the cell
- at
If it is numeric vector, it identifies the positions of the ticks. It can exceed
ylimvalue and the exceeding part would be trimmed automatically.- labels
labels of the ticks. The exceeding part would be trimmed automatically. The value can also be logical (either an atomic value or a vector) which represents which labels to show.
- tick
Whether to draw ticks.
- labels.font
font style for the axis labels
- labels.cex
font size for the axis labels
- labels.niceFacing
Should facing of axis labels be human-easy
- lwd
line width for ticks
- col
color for the axes
- labels.col
color for the labels
Value
Object ccCellGeom
