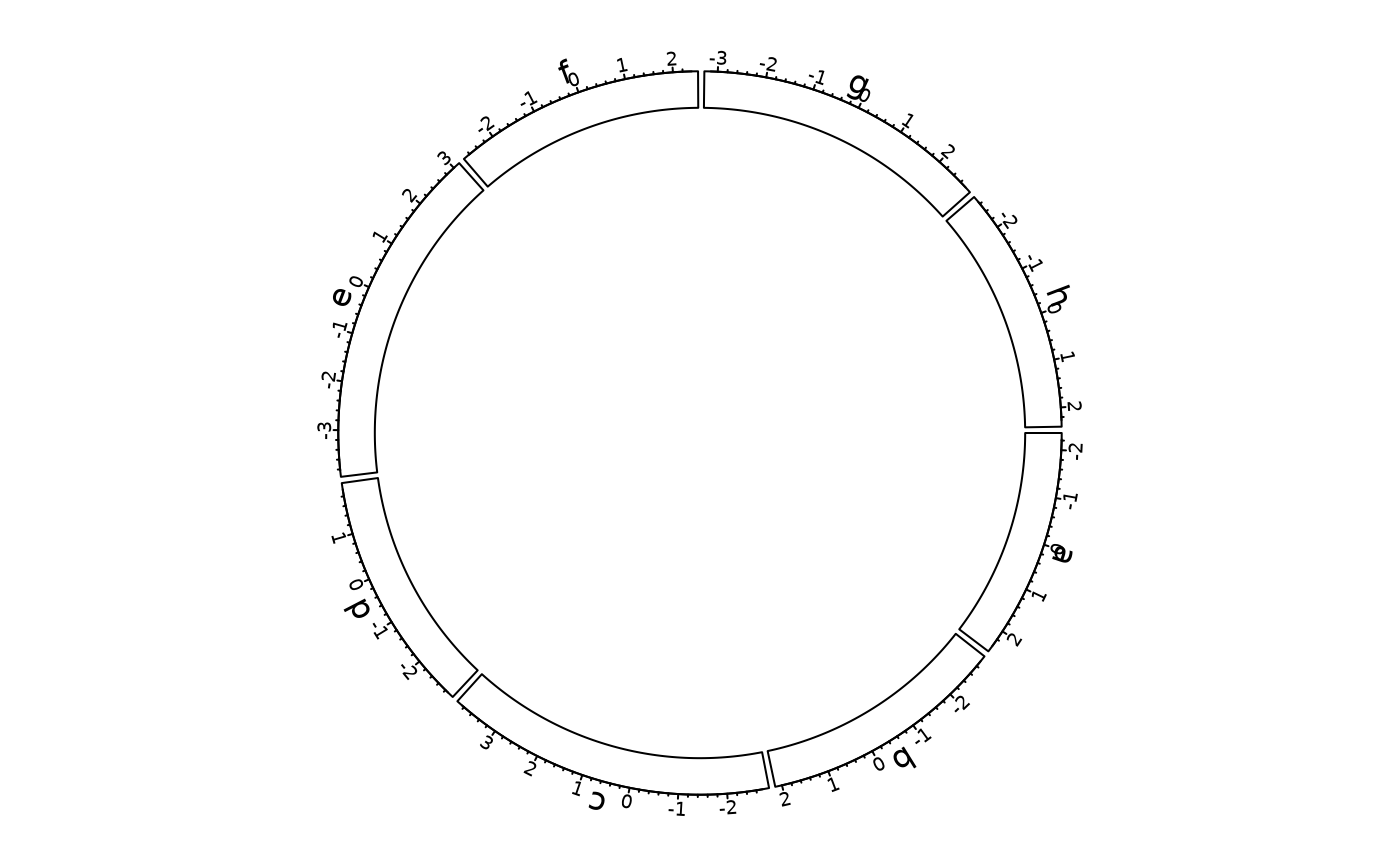
A generic function of show ccPlot
Arguments
- object
Object of ccPlot
Examples
library(circlizePlus)
n = 1000
df = data.frame(sectors = sample(letters[1:8], n, replace = TRUE),
                x = rnorm(n), y = runif(n))
library(circlizePlus)
par1=ccPar("track.height" = 0.1)
cc=ccPlot(sectors = df$sectors, x = df$x) + par1
track1 = ccTrack(sectors = df$sectors, y = df$y,
                 panel.fun = function(x, y) {
                   circos.text(CELL_META$xcenter,
                               CELL_META$cell.ylim[2] + mm_y(5),
                               CELL_META$sector.index)
                   circos.axis(labels.cex = 0.6)
                 })
cc=cc+track1
show(cc)
#> Note: 1 point is out of plotting region in sector 'a', track '1'.
#> Note: 1 point is out of plotting region in sector 'b', track '1'.
#> Note: 1 point is out of plotting region in sector 'c', track '1'.
#> Note: 1 point is out of plotting region in sector 'd', track '1'.
#> Note: 1 point is out of plotting region in sector 'e', track '1'.
#> Note: 1 point is out of plotting region in sector 'f', track '1'.
#> Note: 1 point is out of plotting region in sector 'g', track '1'.
#> Note: 1 point is out of plotting region in sector 'h', track '1'.
